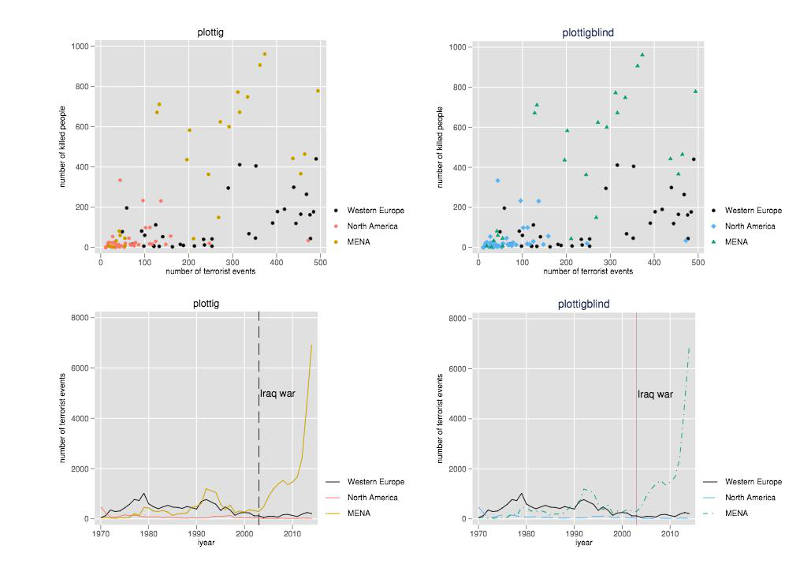
Would you be surprised to find out that the figures above were made in Stata? I discover the work of Daniel Bischof about a year ago and it has changed the way I think about Stata figures.
I have been a long time user of ggplot2, the graphing R package by R Guru Hadley Wickham. Some of my publication figures using ggplot2 are dozens of lines long. I enjoy fiddling with every aspect of the aesthetic to make a perfectly clear visualization. I also enjoyed making my own ggthemes to automate some of my particular preferences.
Then I took a job with ERGOT. Our group loves Stata. It seemed like too much work to write everything in R when only one other person could read it. So I decided to dive into Stata graphics and figure out how to make pretty plots. I yearned for that ggplot2 feel and the control of ggthemes. Then came along plotplainblind and plottig.
Bischof’s package is a must have for any Stata user interested in making beautiful figures. While Stata does have some reasonable schemes built-in, the simple beauty of plotplainblind makes it my go-to scheme. Moreover, plotplainblind also features colors that are distinguishable to those with color blindness (ggplot2 users can find a color-blind safe palette here).
I’ll post a gist in an update to this post.
comments powered by Disqus